Foreword
The rolling mill is one of the core equipment of the rolling mill. Its working efficiency and equipment reliability directly determine the production capacity of the enterprise. The rolling mill drive shaft is an important key component of the rolling mill. The failure of the rolling mill or the damage directly affects the production process, resulting in huge losses.
With the increasing rolling speed and output, the contradiction between rolling equipment and its working load is becoming more and more obvious. At the same time, in the rolling steel production process, due to its special process system, such as rough rolling R1 and R2 are reversible rolling mills, it is necessary. Frequent start-up and braking, as well as sudden biting and throwing of the rolling stock, can cause sudden changes in the rolling mill load and form a certain degree of damage. Many domestic steel companies have repeatedly experienced major accidents such as the rolling of the main drive system of the rolling mill, which seriously affected the normal production of the enterprise. Due to the lack of corresponding monitoring means, it is impossible to judge the basic state of the main drive system at the time of the accident, which brings difficulties to the search and control of the cause of the accident, let alone the warning of the accident and the life expectancy of the main drive shaft.
There are many reasons for the failure of the rolling mill drive shaft. It is often difficult to analyze with general load and strength design calculations. Research shows that such damage is mostly related to the torsional vibration of the drive shaft. Whether the main drive system of the rolling mill produces torsional vibration during production, the torsional vibration amplification factor is reached, and whether destructive resonance occurs, which is an urgent problem to be solved in production and equipment safety. In view of this situation, in order to fundamentally avoid the occurrence of the main drive system accident of the rolling mill, improve the operating rate of the equipment, and carry out on-line monitoring and analysis of the torque of the main drive system of the rolling mill, so that the operator can operate scientifically under the guidance of the monitoring system, Has important practical significance.
The drive shaft torque and torsional vibration of the rolling mill are closely related to the rolling process parameters. This project conducts online monitoring and analysis of the torque test signal to obtain the maximum, minimum and average values ​​of the torque per pass during the rolling process. Through online monitoring data and theoretical analysis, the rolling torque prediction model is established, and the theoretical calculation value is compared with the actual test value to optimize the rolling process parameters, improve the rolling rhythm, expand the production capacity, protect the equipment safety, and improve the equipment integrity. rate.
Development of torque monitoring system for roughing mill
2.1 Monitoring object and measuring point arrangement
The monitoring object of this system is the unit drive shaft torque. The main test contents are:
R1, R2 main drive shaft torque, speed, power, steering;
Process quantity (including rolling force P, main motor current, coil number, rolling pass, material, slab size, tapping temperature, R1 and R2 outlet temperatures, inlet and outlet thicknesses, temperatures, etc.).
Among the above monitoring objects, the four main objects of the main drive shaft torque, speed, power, and steering are real-time synchronous monitoring signals, and the eight process quantity signals are system auxiliary signals.
The torque measurement points are selected on the upper and lower universal joint shafts (Fig. 1). Attach 4 pieces of resistance strain gauges on the drive shaft in the direction of 45° with the axis as shown in Fig. 2, and form a full bridge test circuit as shown in Fig. 3. The bridge signal is transmitted through the wireless telemetry device and the embedded data acquisition system. Transfer to the server. The statistics of the torque monitoring points of the roughing mill are shown in Table 1.
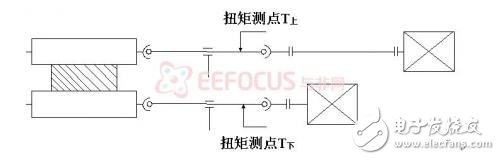
Fig.1 Schematic diagram of the main drive measuring point arrangement of R1 and R2 rolling mills
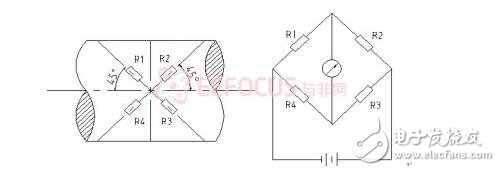
Figure 2 Schematic diagram of the torque test patch
SHENZHEN CHONDEKUAI TECHNOLOGY CO.LTD , https://www.siheyidz.com