How to debug labview is a problem that we often encounter when using NI LabVIEW software. When the software can't run as expected, we may need to have our own debugging skills and technology toolbox. Some of these techniques and techniques are commonly used, and the rest may be some of the tricks you have explored yourself.
Figure 1. A clever debugging method that removes the vulnerability.
We talked to JKI's LabVIEW Architects (CLA) and friends in the LabVIEW community to learn some "top secret" techniques for quickly identifying, isolating, and fixing vulnerabilities. We learned the following clever debugging techniques.
Using probe
Probes are the first and simplest tool for LabVIEW debugging, but they are very powerful tools. It's extremely easy to place the probe on the line and keep getting information as you find the problem. Here are a few features of the probe:
Save connection value function
The Save Wire Value feature in the LabVIEW development environment is often overlooked. When you enable the wire value save feature for a VI, LabVIEW automatically stores the last value for each wire on the VI block diagram. Then, hover your cursor over any of the wires, even if the VI is not running, the probe tool will display a prompt to display the last value of the wire.
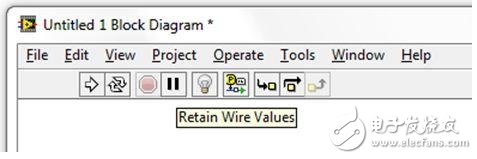
Figure 2. The Save Wire Value button is next to the Light Bulb icon.
Custom probes without writing any code
With LabVIEW Custom Probes, you can create powerful, complex debugging tools without writing any code. For example, you can create a Historical Probe that displays previous values ​​for any number of wires in Custom Probes, Controls, Waveforms. This can help you discover patterns or trends in the data you are exploring without having to write special probe code.
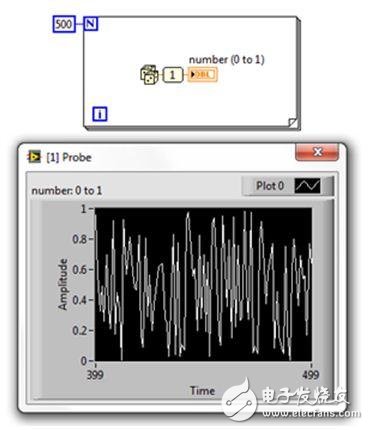
Figure 3. Using a waveform probe to display historical values ​​for simple digital connections.
Get custom probes from the LabVIEW Tools Network
Extend your toolbox with a probe created by someone else. SAPHIR offers a range of free custom LabVIEW probes on the LabVIEW Tools Network. Simply download and install the VI Package Manager (VIPM) Community Edition (also free), search for ViBox, and install the probe in a few clicks.
If you are using LabVIEW 2011, you can also get a ViBox from the LabVIEW Tools Network by clicking Find LabVIEW Add-ons... in the LabVIEW Getting Started window.
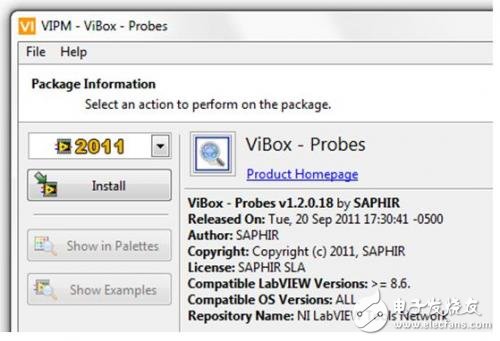
Figure 4. Installing the SAPHIR custom probe using VIPM.
Hangs when called
Many LabVIEW program architects don't even know that LabVIEW has this feature. The "suspend on call" feature suspends execution so that you can do any or all of the following:
1. Feel free to change the control value of the VI before the VI runs.
2. The VI returns to the calling program and arbitrarily changes the value of the display.
3. Run the VI repeatedly without returning execution to the calling program.
4. Skip the VI execution altogether and return to the calling VI.
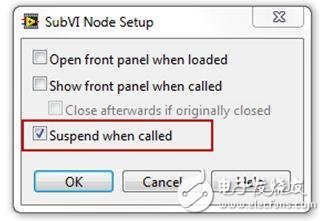
Figure 5. In the SubVI Node Settings window, select the "Suspend on Call" feature.
For a suspend function on call, NI gives a brief description, see here. However, the best way to become familiar with this feature is to practice it yourself.
Unwired front panel controls and displays
Recommended for the FIRST (Promoting Science and Technology) Robotics Competition Team, a technology that is also useful for professional LabVIEW developers
Ben recommends adding a front panel control or display control to the VI, but it is not connected to the connector. These controls and displays work similarly to the Debug input or output, which you can manually control while testing. This makes it easier to generate accidental or extreme events in your application without the need for extensive support or writing of emulation code.
You can also use these debug controls and displays in your built-in applications, provided the LabVIEW Application Builder includes the VI front panel.
See the introduction on LVMastery.com to learn more about Ben's recommended debug subVI.
Execution tracking
If other methods fail, sometimes all you can do is step through the code. There are several ways to perform an execution trace within LabVIEW when you encounter such problems.
The most obvious way is to use the "highlighting execution" feature built into LabVIEW, also known as the "bulb." If the probe is the primary tool for LabVIEW debugging, the light bulb is ranked second. However, if you encounter complex or time-related vulnerabilities, you can choose other more effective tools.

Figure 6. The execution tracking function has more features than the light bulb.
Track disk or memory
An easy way to initiate execution tracking is to record a wire value in one of the subVIs. You can write a simple VI, log the value to a file, or even create a custom probe to display the historical value of the connection. Usually with such a simple trace you can gather enough information to help you find the cause of the vulnerability.
NI LabVIEW Desktop Execution Trace Toolkit
If you are debugging a large, highly parallel application, the LabVIEW Desktop Execution Trace Toolkit with NI Developer Suite 2011 is the "tool" for LabVIEW code analysis. It provides a variety of information about running applications, including detailed memory allocation and redistribution, event generation, and custom information defined by code. Fabiola De la Cueva, one of the founders of the AusTIn LabVIEW Program Architects Forum, pointed out that the toolkit can be used to debug crashed applications because it runs independently of LabVIEW.
Figure 7. Manual execution tracking is risky (image taken from Oliver Widder)
Professional LabVIEW developers are fortunate because the LabVIEW Desktop Execution Trace Toolkit is included in the NI Developer Suite 2011 at no additional cost.
unit test
Test Driven Development (TDD) is a software engineering technique that helps you create better code from scratch, and it is also an effective tool to help you debug existing code.
In TDD, when you find a vulnerability in your application, the first step in the debugging process is to create a unit test that reproduces the vulnerability and causes the test to fail. Only then will you be able to start trying to fix the problem. If the unit test passes, you have cleared the vulnerability.

Figure 8. Where did you test the code?
This bug fix method takes a bit of time, but it has several advantages over other less precise methods:
1. Unit testing is traceable to show the full occurrence of the vulnerability and how you can isolate the vulnerability
2. You or another developer can easily verify or re-verify your fix at any time without having to remember the details of the activation vulnerability.
3. Unit tests can be automated with other tests in your project, so if the vulnerability reappears, you can know immediately.
There are two main LabVIEW add-ons for unit testing, and the TDD method can be used with another. Check out JKI's Free VI Tester LabVIEW Add-on Tool or see Eli Kerry's LabVIEW Software Engineering Guide to further understand the LabVIEW Unit Test Framework Toolkit, which is included in the NI Developer Suite.
Here to share a labview-based USB debugging assistant for writing and receiving data, an extremely simple program case.
First, preliminary preparation
First introduce the USB device (STM32 USB), the device communicates with the host through two interfaces of one interface, the two endpoints are the endpoint 1 input and the endpoint 1 output respectively. Both endpoints are interrupt endpoints.
Well, let's formally introduce the USB debugging assistant based on labview.
The HID class of the USB port can be easily recognized by the Windows system because it has a built-in USB HID driver. But this driver is not recognized by labview. To be recognized by Labview, you need to install the USB driver generated by VISA. (Personal feeling this is a bad place for labview) The specific operation method is:
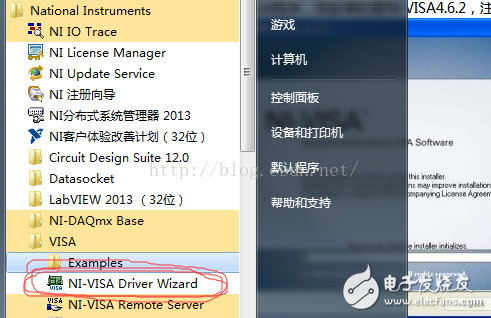
Open the NI-VISA driver wizard
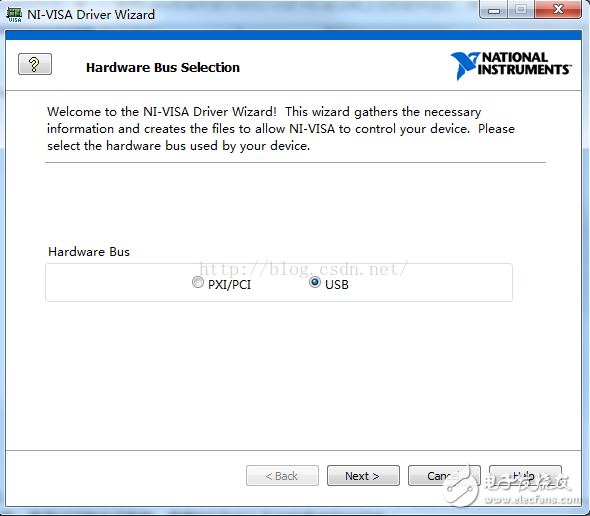
Select USB, click NEXT
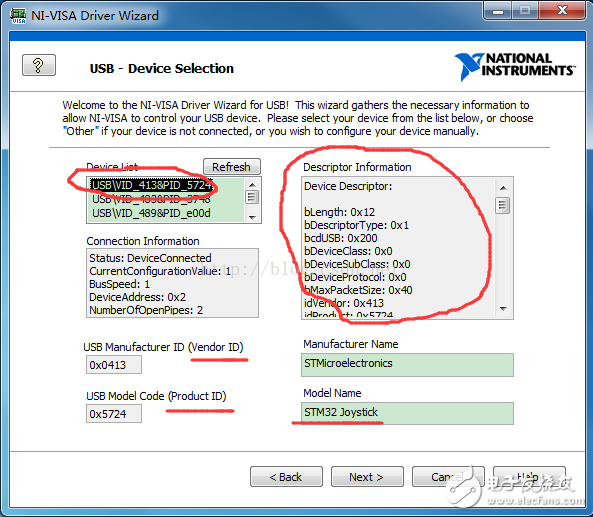
Since my USB device has been plugged in on the computer, the VISA installation wizard recognizes it and we select it directly. At this time, you will find that they are automatically filled out, and we don't have to fill it out ourselves. Including Vendor ID, Product ID, Descriptor InformaTIon (you can view various descriptors), Model Name (the name to be displayed by the device manager), we click NEXT, go to the next step (you may jump out of the small window after clicking, we will click Yes) ,by)
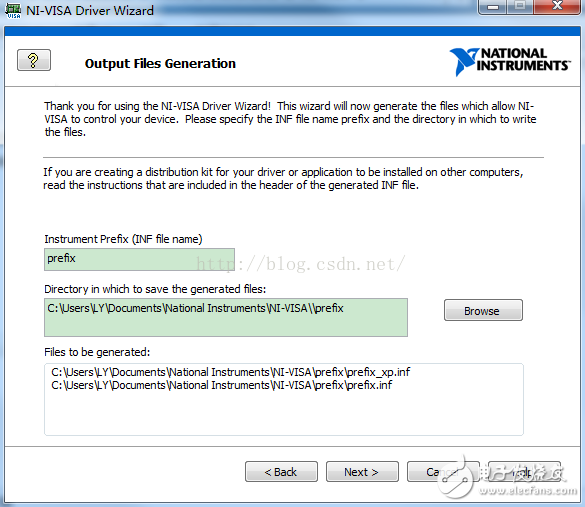
The next step is Output Files GeneraTIon, we can directly make next without making any changes.
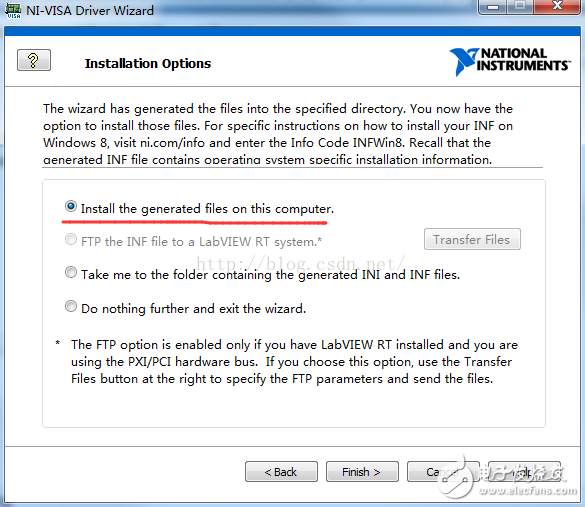
The final step is the Installation Option, we choose the first installation, then click Finish.
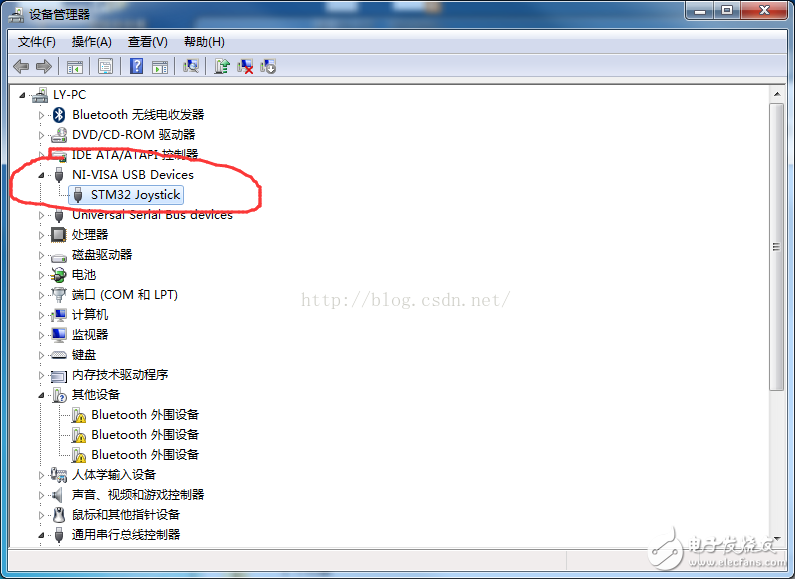
Then the system starts to install the driver. The situation I encountered was that the installation was complete. It popped up a small window saying that the installation was unsuccessful. We don't care if it is directly closed. Then at this time we go to the device manager to see that there are drivers that can be recognized by labview.
So how to view our USB can be recognized by labview. We turned on NI-MAX, and if we can see our USB device at the device and interface, the instructions have been identified. (I usually look at 0x0413::0x5724 to identify my USB port, because these two parameters are my own settings.)
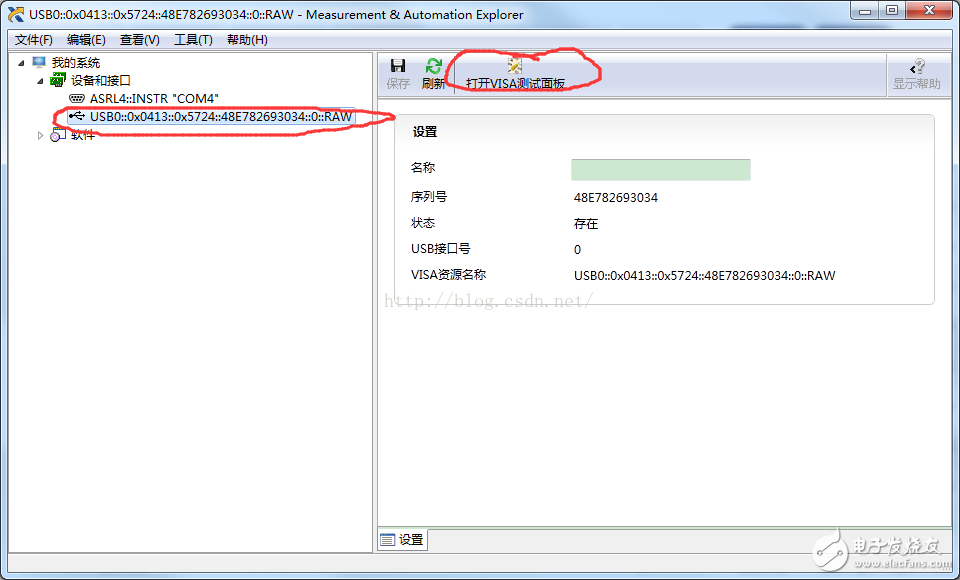
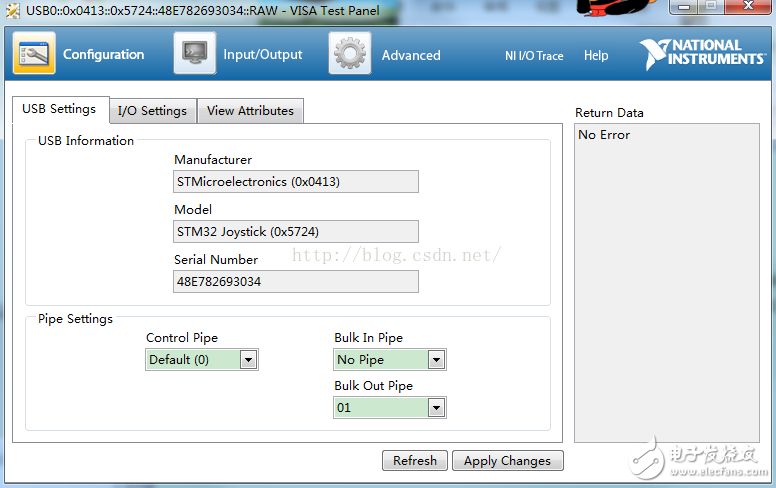
We chose to open the VISA test panel and you can see some USB status. This also proves some information about the USB device and continues to go down.
Above we have verified that NI can recognize the USB port, we started to write a small assistant program.
Second, the program is writtenCreate a new VI file.
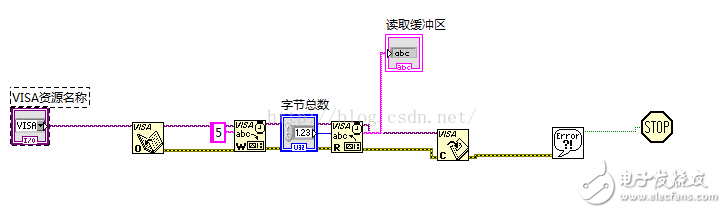
Because of the use of VISA communication, we must think of looking for a driver in VISA. First drag a few common ones out. (They are all in the instrument I / O - VISA, specifically which location I will not say) VISA open, VISA write, VISA read, VISA closed. So we connected this structure
As a result, I opened the VISA resource and found that it was COM4. I was forced to use it. The USB port I mentioned above was recognized.
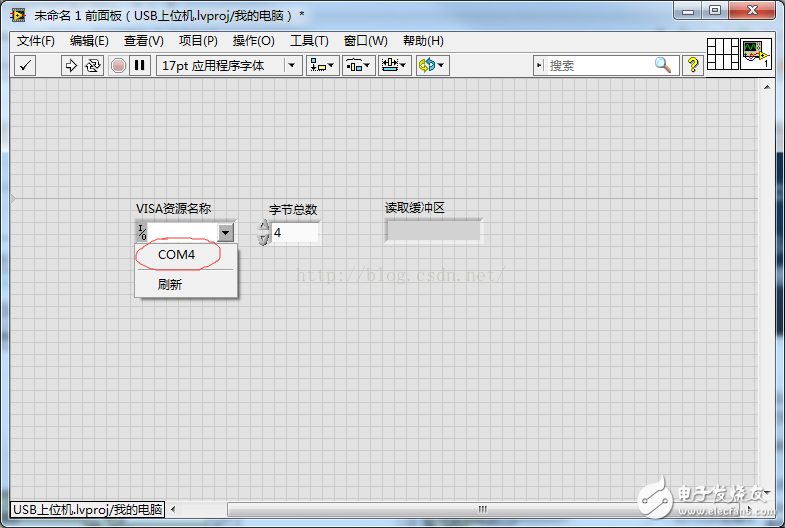
Studying some (actually forgetting where to check it out) The problem lies in the VISA resource name. On this control, we need the device to recognize the VISA class as USB. The specific setting method is to right click on the control - "Select VISA -" I / O session - "USB Raw
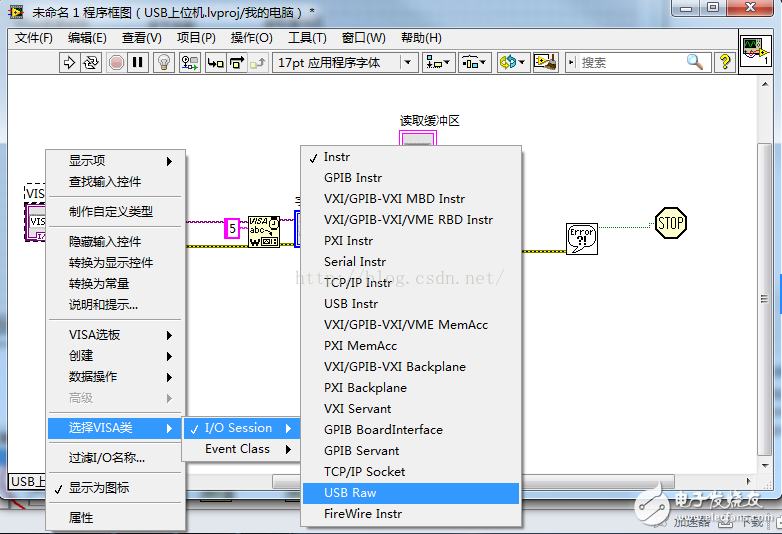
Once the Ok is set, we can find the USB device! Let's run it and see the effect, and the result comes out of this ghost thing.
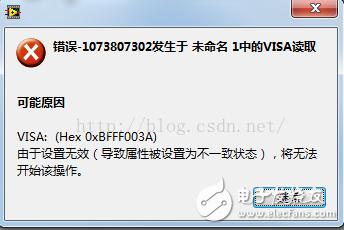
There is a big god on the electronic enthusiasts online has given a solution to this problem: you can refer to
Http://bbs.elecfans.com/jishu_515959_1_1.html
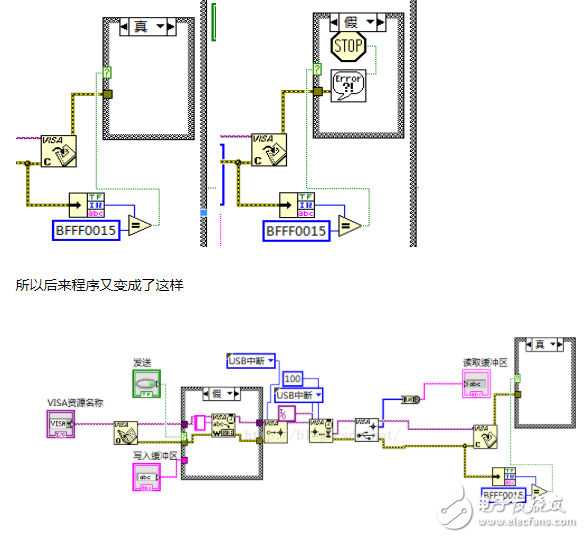
I would probably say that the HID class only supports control transfer and interrupt transfer. After the host needs to send a command, the USB device returns information so that the reading can be completed. So we need to use the interrupt method for data reading. In accordance with the solution given above (very detailed) we make changes. Then the program has become like this again.
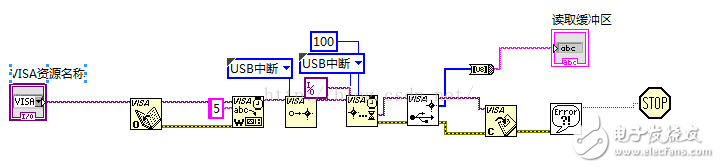
Then run the program and finish it. In conjunction with the history of USBHID communication written in the previous blog post, we sent the character 5 to the device through the host computer through the host computer, and then the device sends the received character to the host. We also read the character 5! ! ! At this point, simple USB communication is already available. However, we are the ones who want to be communication assistants. We can't stop there.
We continue to modify, the article in the above URL mentioned "note that you must read the data returned by the usb interrupt after the visa is written. If you do not write or write the data error, there will be no return value, it will A timeout error occurred VISA: (Hex 0xBFFF0015) The timeout has expired before the operation is completed."
After the actual measurement, it is indeed like this. So we solve it through a conditional structure. When the data needs to be sent, the button is sent. The condition is true. Labview will send the data written to the buffer. When it is not necessary to send, the condition is false, and the system sends 0 bytes.
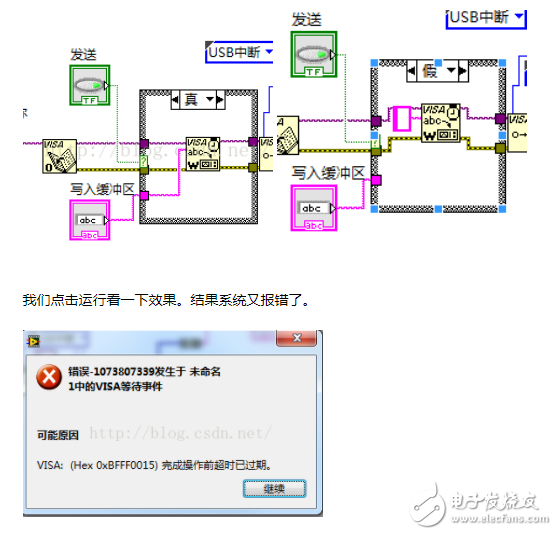
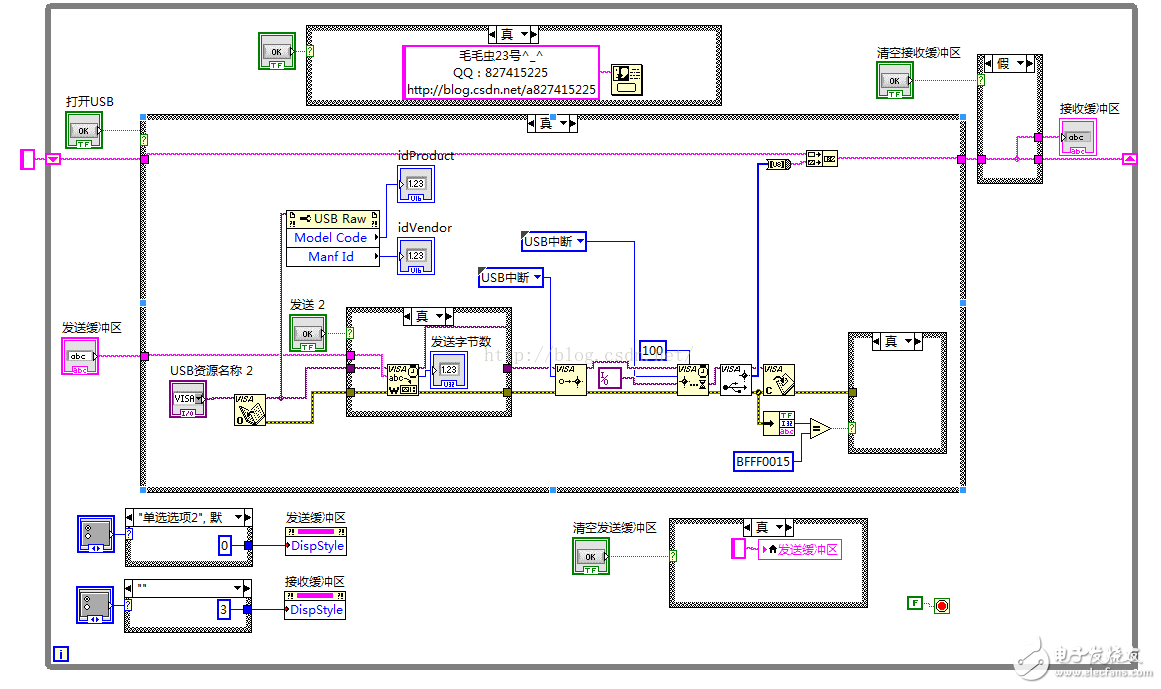
Say that the system timed out before completing the operation, the problem is in the VISA waiting event, why is this? It turns out that we set the enable interrupt transmission time. As a result, this interrupt transmission has not occurred, and no data is read through the interrupt transmission. So the system reported an error. But think about it, USB devices want to send data to send data, there is no data to send, you want it to send some valid data, is also an unreasonable request (USB device heart: you report your own mistakes, blame me) how to do? Since we understand the reason for the timeout, he is not a problem for our USB communication, then we will ignore it! The specific operation method is:
Get the wrong report code (0xbfff0015) and then we will not process it when it finds that it is a timeout error, no need to pop up the error window
At this time, the program can be run normally, the main part is completed, and some subtle parts are introduced below.
1. Use the shift register to implement the non-overlay display of the read buffer.
2, using the conditional structure to control the opening and closing of the USB port
3, call the send buffer and receive buffer display style property node control properties
The final final program is like this
The front panel is like this
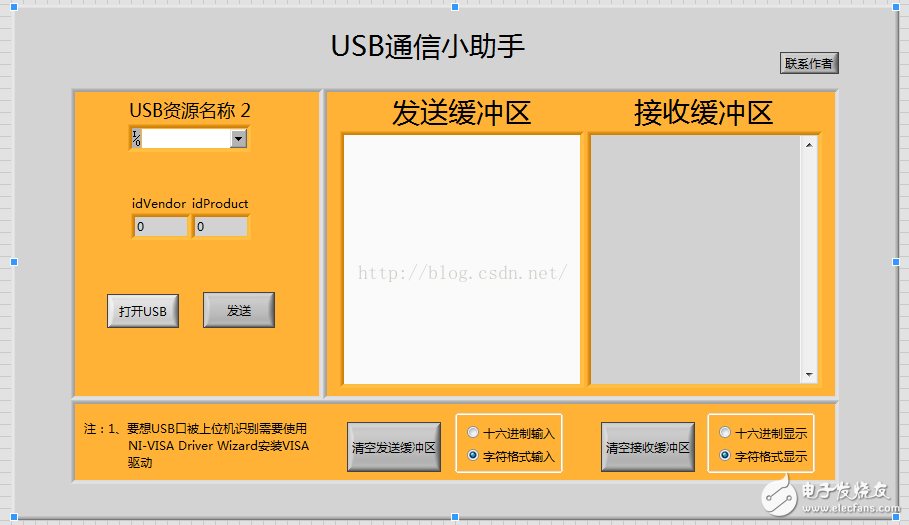
At this point, the USB communication assistant is completed!
How to debug LabVIEW programs
In practical applications, programmers often combine the various debugging tools described above. According to a variety of prompts and auxiliary information, you can quickly locate the source of the error, and observe the detailed process of part of the code execution, and finally eliminate the error to achieve the purpose of debugging the program. Let's share with you how to debug the LabVIEW program.
Debugging tools are functions that must be provided in any kind of program development environment, which can significantly improve the development efficiency of programmers. As an IDE tool for graphical programming languages ​​(and a unique language), LabVIEW naturally needs to consider providing engineers with tools for graphical language debugging.
In fact, LabVIEW does not specify which tools are divided into debugging tools and which tools are divided into other tools. This kind of boundary and definition is rather vague. In actual use, we can refer to the tools that assist programmers to locate code execution and bugs more accurately and quickly, collectively as "debug tools."
LabVIEW's main debugging tools are located on the toolbar, as shown in Figure 1. From left to right are:
Run: Run, click it will run the current VI directly, shortcut Ctrl + R.
Run Continuously: Run continuously.
Abort Execution: Aborting the run, clicking it will stop the currently running VI.
Pause: Pause running.
Highlight Execution: Highlight the execution tool. Clicking on it will slow down the process and reflect the entire data flow.
Retain Wire Values: Clicking on it will preserve the value on the current connection line (this will be described later).
Start Single Stepping: Single step execution, when the program runs one node forward.
Step Over: Skip the current node.
Step Out: Jump out of single step execution.
Step Into: Enter into a subVI to execute.
Among them, (1)~(4) are commonly used tools to control the running, pause and stop of VI; and (7)~(10) are available in other programming languages ​​of IDE environment, and there is no other usage. the difference. Therefore, this article will focus on the unique program debugging tools or methods in LabVIEW.
![]()
Figure 1 LabVIEW Toolbar
1.1 Error List (Error List)
As a graphical compiled language, LabVIEW is compiled automatically in the background (no need for programmers to manually compile), and the compiled object code is also stored in the vi file. LabVIEW therefore "real-time" to determine if the code is working. When it is not working properly, the Error List dialog box will pop up, listing all the errors in the current VI inheritance, as shown in Figure 2.
The dialog box is divided into three parts, which represent the VIs where the error occurred, the node where the error occurred, the simple description of the error, and a detailed description of the error. Double-click on a VI to open the VI directly. Double-click on an error node to directly locate the node.
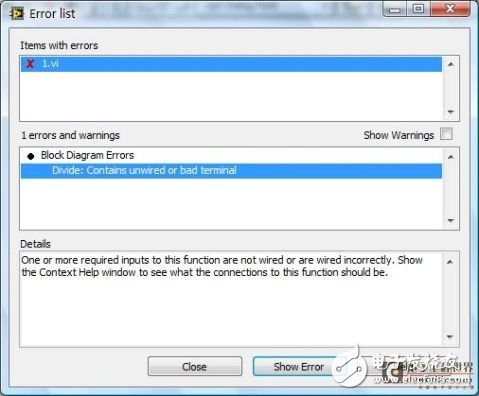
Figure 2 Error List dialog
This method is usually used to quickly locate the VI or node where the error occurred and modify it according to the error description. Sometimes LabVIEW's Run arrow is broken, and the Error List dialog does not show any errors. This is because LabVIEW's compiled code in memory cannot be executed. You only need to re-compile the current VI by holding down the Ctrl key while clicking the "Run" arrow (pre-LabVIEW 8.6.1 versions may be Is the Ctrl + Shift key).
1.2VI inheritance and calling (VI Hierarchy)
LabVIEW allows and encourages calls to subVIs, so there is a call-to-call relationship between VIs. LabVIEW graphically represents this relationship as "VI inheritance" (dynamically invoked VIs will not display them). Call the relationship with the call). Select the View > VI Hierarchy menu item to pop up the relationship diagram between the VIs, as shown in Figure 3.
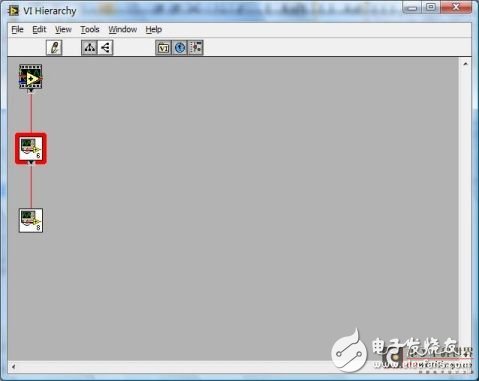
Figure 3 VI Hierarchy
From the figure, you can quickly see the relationship between the current VI's subVI and the VI being called. Double-clicking on a VI's icon will quickly open the VI front panel.
ã€Tips】
Double-clicking on a VI icon while holding down the Ctrl key directly opens the back panel of the VI.
When LabVIEW is paused in a VI, the list of VIs that the current VI is called is displayed in the back panel toolbar, as shown in Figure 4. As can be seen from the figure, the current VI is being called by 1.vi. Click this option to see the list VIs of the entire called relationship. When you select a VI from the list, LabVIEW automatically locates the VI.
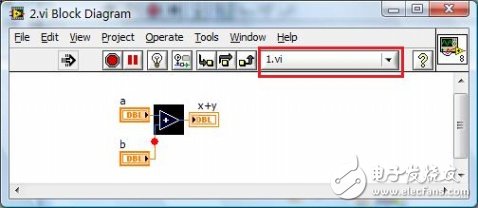
Figure 4 VI Caller Chain
1.3 Breakpoint Tool (Breakpoint)
LabVIEW Run can set a breakpoint for any node and wire in the back panel, and the program will pause when it runs to the breakpoint position.
Right-click on the location where you want to place the breakpoint, select the Breakpoint menu item in the pop-up menu, and use the Set Breakpoint command to place a breakpoint at the current position, as shown in Figure 5.
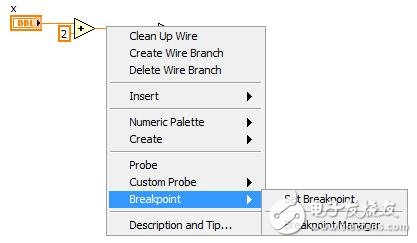
Figure 5 Breakpoint shortcut menu
When the mouse is right-clicked at a position where a breakpoint already exists, the shortcut menu shown in Figure 6 pops up. The Clear Breakpoint menu item can be used to clear the current breakpoint, while the Disable Breakpoint can disable the current breakpoint, at which point the breakpoint will no longer suspend execution of the program.
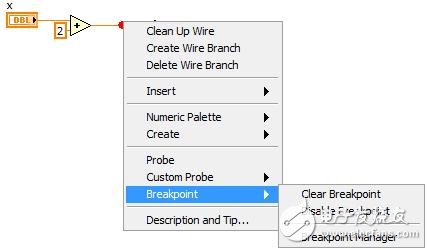
Figure 6 Breakpoint shortcut menu
In large program debugging, breakpoints are often the most frequently used tool, allowing programmers to quickly focus on the VIs they care about, while other VIs execute normally. Usually, in order to find out the cause of a bug, the programmer will set a number of breakpoints in the back panel, and once the bug is cleared, the breakpoints need to be cleared one by one, which is inevitably repeated and cumbersome. LabVIEW 8.6 provides a tool for breakpoint management. You can select the Breakpoint Manager menu item in Figure 5 or Figure 6 to launch the Breakpoint Management dialog (shown directly using the View) Breakpoint Manager menu item. This dialog box lists the breakpoints contained in all the VIs in the current memory. The programmer can choose to arbitrarily breakpoint them in batches or set them to the disabled state.
Keyword: LabVIEW program debugging mode
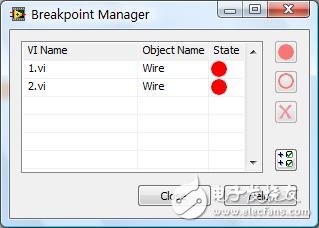
Figure 7 Breakpoint Manager dialog
1.4 Highlight Tool (Highlight)
The highlighting tool is a debugging tool unique to LabVIEW compared to the traditional text-based IDE environment. It is also a reflection of the data flow programming idea. Open the Highlight tool in the toolbar (shown in Figure 8) and click the "Run" button, the program starts running in Highlight mode. At this time, according to the running sequence of the data stream, LabVIEW displays the data on the current terminal on the input and output terminals of each node, and displays the execution mode of the data stream in a small dot manner. Programmers can clearly observe the direction of the data flow and the execution of the source code, which greatly facilitates the detailed debugging of a part of the code by LabVIEW developers.
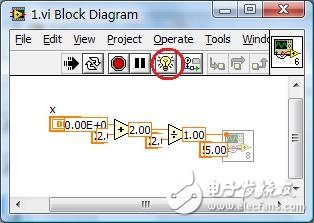
Figure 8 Highlight tool
For beginners, this type of debugging is undoubtedly intuitive and clear. But at the same time, it will also have some impact on some VIs, such as some VIs that have strict control over time. Because LabVIEW slows down program execution in Highlight mode, some time-related events or bugs are masked and ignored. This is also why sometimes the program runs fine in Highlight mode and returns to normal mode without returning the correct result. At this point, you need to use the Breakpoint and Probe tools (described in the next section) to debug together to find out the cause of the problem.
1.5 Probe Tool (Probe)
Probes are not unique to LabVIEW. In many text-based languages, there are Watch windows for monitoring the values ​​of certain variables in real time. Probes in LabVIEW are similar, and are also used to monitor programs in real time. The value on any of the connectors in the back panel (not any node).
Right click on any line in the source code and select the Probe menu item to pop up the probe at the current position, as shown in Figure 9. LabVIEW automatically determines the data type of the current location and calls a different probe to display the data at the current location. When the back panel of the VI is closed, all probe windows in the VI will also automatically close. Run the VI and the current value will be displayed immediately in the probe window when running to the position of the probe.
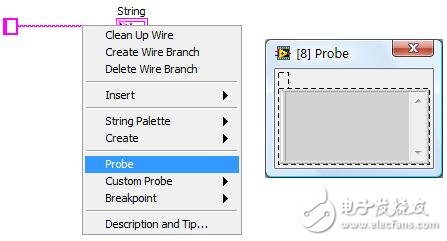
Figure 9 Probe tool
In order to locate the source of the error or find the result of the operation at a certain time, the programmer often needs to cooperate with the breakpoint and the probe tool to add a breakpoint at the appropriate position and add the probe at the appropriate position. Or set the probe tool directly so that the probe captures a specific condition that the program is halted. As shown in Figure 9, selecting the Custom Probe "Conditional String Probe" menu item will pop up the probe window shown in Figure 10. In the Condition page, you can set the conditions for the program to pause. When this condition is met, the program will immediately pause at the current probe position.
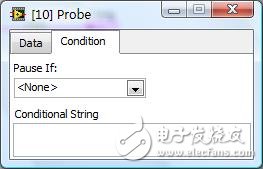
Figure 10 Conditional String Probe
As can be seen from Figures 9 and 10, the main function of the probe is to display the data on the current connection in the form of an indicator. Because in LabVIEW, the display of data is customizable, such as using the Type Def. control to modify the appearance of some controls or the String control to display the password in ****, LabVIEW provides custom probe technology. Allows the programmer to use any predefined probes based on actual conditions.
Select the Custom Probe"New... menu item in the shortcut menu of Figure 9, and the custom probe wizard shown in Figure 11 will pop up. The programmer can choose to create a new probe from an existing probe file (as can be seen later, in fact a vi file) or create a new empty probe directly. Select the "Create a new probe" item.
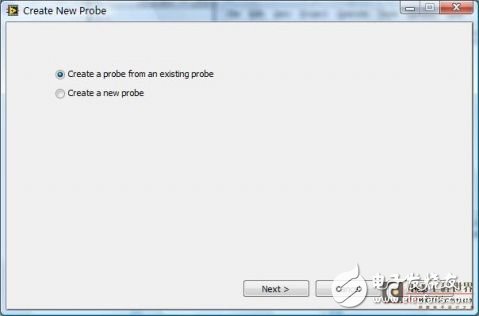
Figure 11 Create New Probe_1
Click the Next button to enter the interface shown in Figure 12. Filename indicates the name of the probe file; Window title and shortcut menu name indicates that the title bar name of the probe VI is also the name that appears in the shortcut menu when the probe is used; Directory to save the probe indicates the storage location of the probe.
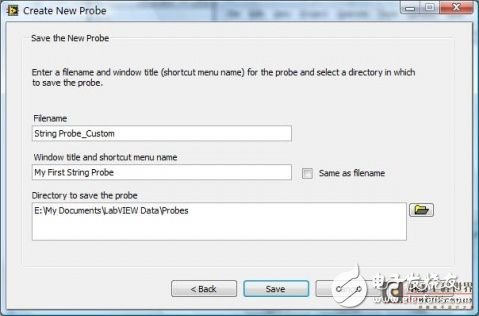
Figure 12 Create New Probe_2
Click the Save button and LabVIEW will automatically generate the probe VI shown in Figure 13. Do not delete any controls on the interface:
The String control represents the current value of the probe position;
A Boolean control represents a conditional breakpoint, and when the value is set to TRUE, the program will pause at the current breakpoint.
In fact, the programmer can arbitrarily modify the appearance of these two controls, such as setting to a custom type, modifying the control's Label or Caption, and even adding new controls to the current VI. However, it is best not to modify the type of control and the Connection (input and output connection terminal) definition, because LabVIEW will choose to call different probe VIs in different locations depending on the type of control.
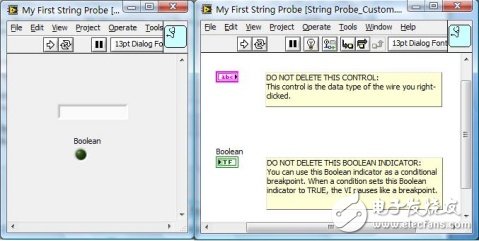
Figure 13 String Probe_Custom.vi
This example will modify String Probe_Custom.vi (download) to cause the program to display the value of String in a different way, and set to pause the program when the value is "Hello". As shown in Figure 14, add the appropriate code and adjust the size of the Probe's front panel window (this is also the display size of the final probe).
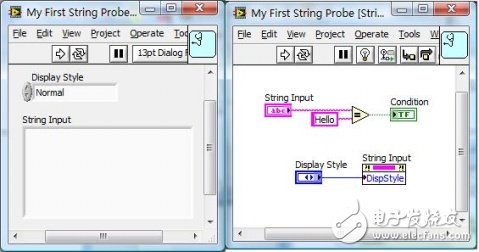
Figure 14 Modified String Probe_Custom.vi
Create a new VI and add a String control. In this case, select Custom Probe > My First String Probe menu item in the shortcut menu, as shown in Figure 15.
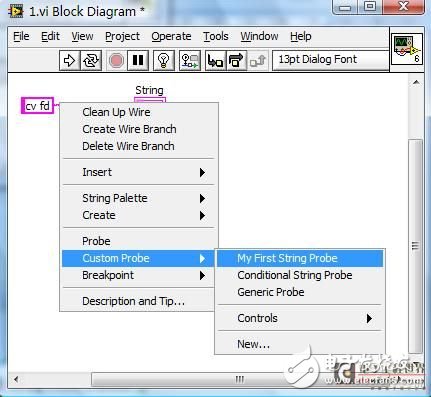
Figure 15 calls the String Probe_Custom probe
At this point, LabVIEW will automatically call String Probe_Custom.vi and display it in the style of the probe window, as shown in Figure 16. To modify the value in the Display Style and run the VI before running the VI, the String display will automatically display the value in the appropriate way.
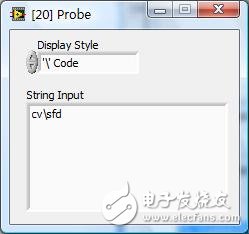
Figure 16 String Probe_Custom probe window
As you can see from the above call procedure, the probe in LabVIEW is actually a call to the VI. Therefore, the following principles must be followed when editing the probe VI:
Do not include any code that waits or executes for a long time in the probe VI, such as loops, events, queues, etc., or LabVIEW will automatically hang when it runs.
Do not modify the default properties of the probe VI, such as setting to Modal. But you can modify its title bar and size.
The probe window displays the current run value only when the program is run to the probe position, and these values ​​are not saved in the wire. That is to say, if you need to detect the value of a certain location, you must add the probe at that location before running. Otherwise, if you add the probe again after the program is running, these newly added probes will not be able to display the running values ​​before the program. .
LabVIEW provides a tool that allows the wires in your program to retain the last run value. Click the “Retain Wire Values†button in Figure 17 to open the tool, and LabVIEW will retain the last run value of the current VI. When the VI is finished running and the probe is added again, the probe will automatically display the last run value at that location. Of course, this also affects the efficiency of the program, so LabVIEW automatically closes the tool when it exits memory.
![]()
Figure 17 Retain Wire Values ​​tool
1.6VI window management (VI Windows)
In the debugging process, in order to track the running status of the subVI, it is often necessary to open a lot of VI windows. Often, by repeatedly pressing the "Ctrl + W" key while closing these windows, LabVIEW provides a way to turn off these VIs at the same time. Click the Windows > All Windows... menu item and the VI window management dialog shown in Figure 18 will pop up. Select the window you want to close (you can use the Ctrl or Shift key to select multiple), and click the "Close Windows" button to close the selected window.
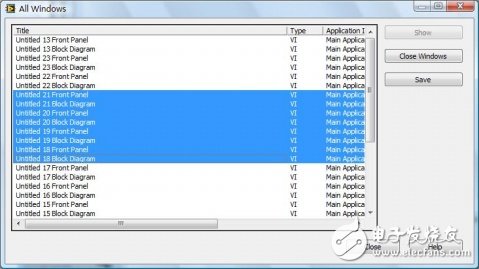
Figure 18 VI window management
ã€Tips】
In LabVIEW, press Ctrl + Tab to switch between different LabVIEW windows (Windows Alt + Tab is toggled between all windows).
Frame For Iphone 14,Metal Frame For Iphone X14Promax,Iphone X14Promax Frame With Glue,Original Frame For Iphone X14Promax
Shenzhen Xiangying touch photoelectric co., ltd. , https://www.starstp.com